“All tools are designed to meet a certain need. Sharp things are for cutting, hard things are for hammering and pointing things for binding things together. GIS is also a tool. Geographers, who needed a tool (more like a toolkit) to answer geographic questions, were the primary designers of the original GIS software. Today, many disciplines have contributed enormously to this growing field, but the questions GIS is designed to answer remain fundamentally geographic ones,” (DeMers 2009).
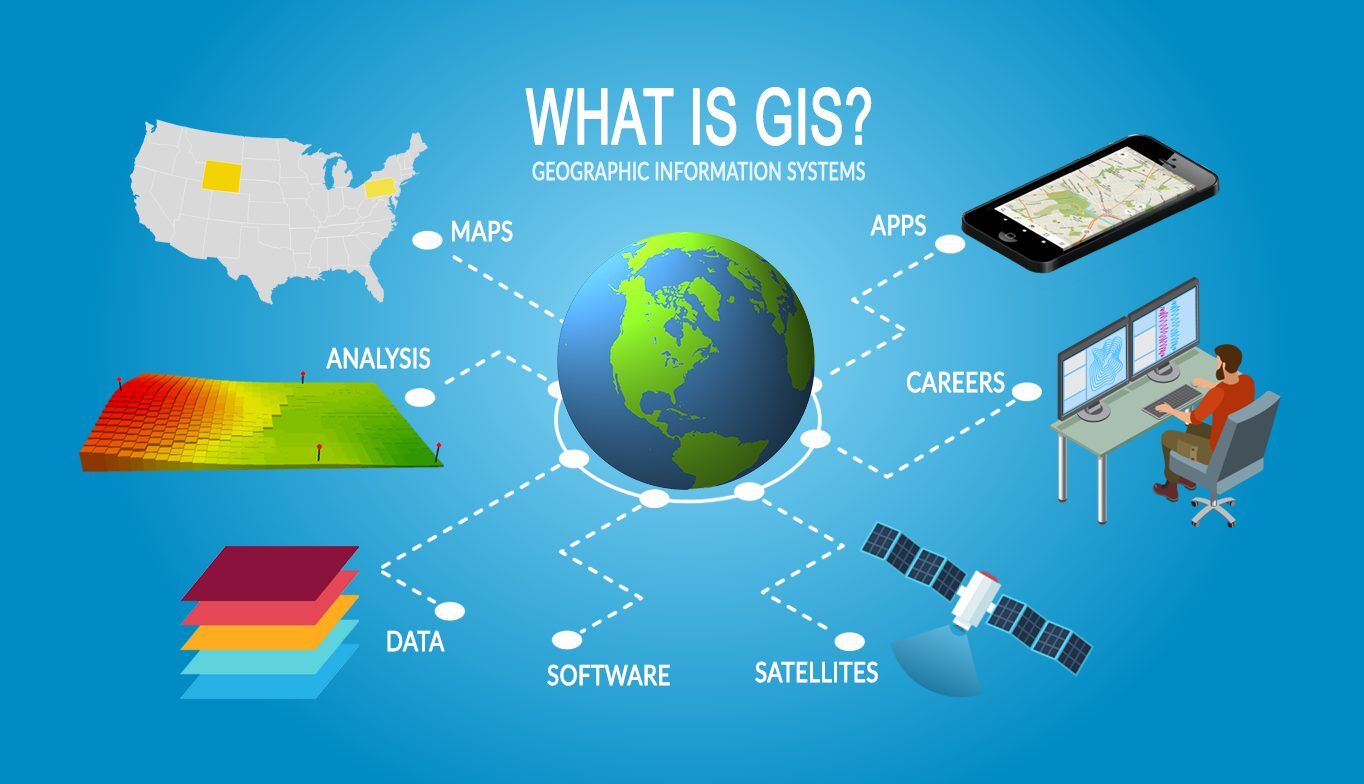
A Geographic Information System is a computer-based set of hardware and software used to capture analyze, manipulate and visualize information. A GIS can organize and display both spatial data and non-spatial data, such as the location of hospitals (spatial) and the number of patients treated for Lyme disease at that location (non-spatial). A GIS can capture, create, manipulate, analyze, visualize, and store information in a map format.
Some of the tasks that a GIS can do:
Better said, a GIS is a model of data in a computer environment that can be analyzed using the computer processor. Why is it a model? A model is a kind of data representation that simplifies or generalizes real-world information. As the creator of a GIS, you make decisions on what to include and not include in the data- that in itself is a simplification of the reality on the Earth’s surface.
A GIS can answer all sorts of spatial questions. Here are a few examples.
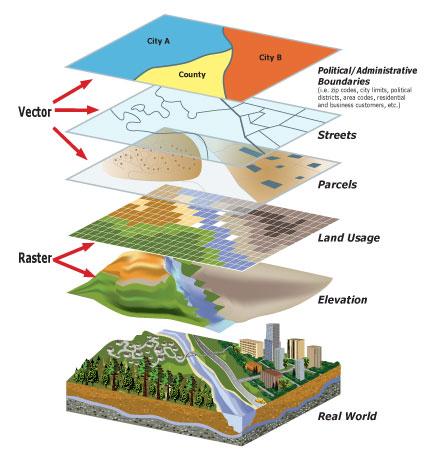
GIS datasets, called layers, are georeferenced and so they can be lined up with one on top of another. All sorts of datasets can be brought together and spatial relationships can be explored and analyzed.